
Worldwide 3D printing spending set to burgeon
January 9, 2019
A new update to the Worldwide Semiannual 3D Printing Spending Guide from International Data Corporation (IDC) shows global spending on 3D printing will be $13.8 billion (€12 billion) in 2019.
This figure represents an increase of 21.2 percent over 2018. By 2022, IDC expects worldwide spending to be nearly $22.7 billion (€19.8 billion) with a five-year compound annual growth rate (CAGR) of 19.1 percent.
Together, 3D printers and materials will account for more than two thirds of the worldwide spending total throughout the forecast, reaching $5.3 billion (€4.6 billion) and $4.2 billion (€3.6 billion) respectively in 2019. Services spending will trail slightly behind, reaching $3.8 billion (€3.3 billion) in 2019 and led by on-demand parts services and systems integration services. Spending growth for materials and software will outpace the overall market with five-year CAGRs of 20.3 percent and 17.1 percent respectively. 
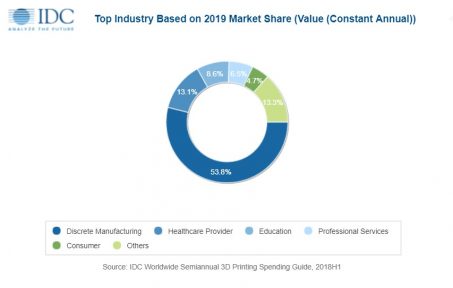
Discrete manufacturing will be the dominant industry for 3D printing, delivering more than half of all worldwide spending throughout the 2018-2022 forecast. Healthcare providers will be the second largest industry with a spending total of nearly $1.8 billion (€1.5 billion) in 2019, followed by education ($1.2 billion/€1 billion) and professional services ($898 million/€784.1 million). Consumer spending will account for less than 5 percent of the worldwide total at $647 million (€564.9 million). By 2022, IDC expects process manufacturing to move into the number 5 position ahead of the consumer segment. The industries that will see the fastest growth in 3D printing spending over the five-year forecast are healthcare (29.8 percent CAGR) and transportation (28.3 percent CAGR).

The leading use cases for 3D printing are prototypes, aftermarket parts, and parts for new products. As the primary use cases for the discrete manufacturing industry, these three use cases will account for 43 percent of worldwide spending in 2019. As spending by the healthcare industry rises, dental objects and medical support objects will become the fourth and fifth largest use cases in 2022, followed closely by specialised tools. The use cases that will see the fastest spending growth are tissue/organ/bone (42.9 percent CAGR) and dental objects (33.1 percent CAGR).
“As anticipated, we are seeing a wider adoption of 3D printing use cases worldwide,” said Marianne D’Aquila, Research Manager, Customer Insights and Analysis at IDC. “3D printing has moved beyond its early days of prototyping in manufacturing and is proliferating to other use cases and industries. The benefits of customised, cost-effective printing are being realised in a more diverse manner, as exemplified by growing spend in aftermarket parts in manufacturing, surgical models in healthcare, and architectural designs in professional services, to name a few.”
“We’ve seen a lot of development on the 3D printing technology side in 2018. Rapid increases in production speeds combined with major advances in 3D printing materials is enabling the use of 3D printing in manufacturing across a wider range of applications,” said Tim Greene, Research Director, Hardcopy Peripherals and 3D Printing. “As more users recognise these benefits they are looking for more ways to use the technology, which drives higher levels of equipment utilisation for prototyping, tooling, and real manufacturing.”
The United States will see the largest spending total in 2019 (nearly $5 billion/€4.3 billion) followed by Western Europe ($3.6 billion/€3.1 billion) and China (nearly $2 billion/€1.7 billion). The regions that will see the fastest spending growth over the five-year forecast period are Latin America (25.3 percent CAGR) and China (21.6 percent CAGR). Five of the nine geographic regions are forecast to see compound annual growth rates greater than 20 percent over the forecast period.
The Worldwide Semiannual 3D Printing Spending Guide quantifies the opportunity for 3D printing, which enable the creation of objects and shapes made through material that is laid down successively upon itself from a digital model or file. Spending data is available for 15 use cases across 20 industries in nine geographic regions. Data is also available for 3D printing hardware, materials, software, and services.
Categories : Around the Industry
Tags : 3D printing Data IDC Spending